The Republic Institute of Statistics in the book "Religion, Mother Tongue and National Affiliation" publishes the final results of the 2011 Census of Population, Households and Dwellings on ethno-cultural characteristics (of religion, mother tongue, national commitment i age of the population) of the Republic of Serbia, by municipalities and cities.
The 2011 census was conducted in the period from October 1 to 15, 2011, in accordance with the Law on the Census of Population, Households and Dwellings ("Official Gazette of RS", no. 104/09 and 24/11).
Religion
The answer to the question about religion is the result of an individual's personal conviction based on his understanding of religion and
freedom of expression of religion, which is guaranteed by the Constitution.
In the period after the Second World War, the question about religion was asked in the 1953, 1991, 2002 and 2011 censuses.
According to the results of the 2011 Census, over six million inhabitants of the Republic of Serbia are of the Orthodox faith (84,6 percent of the total population).
The second most numerous are the Catholics, with 350 thousand (5 percent).
The third most represented religion is Islam, with more than 220 members (3 percent).
Compared to the 2002 Census, the number of non-believers (atheists) increased by 40.
Population according to religion, according to the censuses of 2011 and 2002*.
| Orthodox
| 6.079.396
| (6.371.584) |
| Catholic
| 356.957
| (410.976) |
| Protestant
| 71.284
| (78.646) |
| The rest are Christian
| 3.211
| (2.191) |
| Islamic
| 222.828
| (239.658) |
| Judaic
| 578
| (785) |
| Eastern religions
| 1.237
| (240) |
| Agnostics
| 4.010 |
| They are not believers (atheists)
| 80.053
| (40.068) |
| They did not declare themselves
| 220.735
| (197.031) |
| Unknown
| 99.714
| (137.291) |
| Other
| 1.776
| (6.649) |
Mother tongue
In the census, the mother tongue is the language spoken by the person in his earliest childhood, that is, if more than one language is spoken in the household, the language that the person considers to be his mother tongue. Data on the mother tongue are presented for 17 different languages that are most often spoken in the Republic of Serbia, that is, those languages that at least 2 people consider as their mother tongue.
The "Other languages" modality contains aggregate data for languages that less than two thousand people consider their mother tongue (Ukrainian, Goran, Chinese, Czech, etc.).
The modality "They did not declare and unknown" contains aggregate data for the number of persons who did not want to declare, then the total number of illegible answers, answers that do not represent a declaration of mother tongue (native, human, bilingual, polyglot, Cyrillic, Niš, Lalin, etc. .) and the total number of unwritten answers.
In 2011, the census was not conducted in the territory of AP Kosovo and Metohija, while in the municipalities of Preševo and Bujanovac and partly in the Municipality of Medveđa, a reduced coverage of census units was recorded due to a boycott by the majority of members of the Albanian national community.
The difference between the total number of persons of the Christian religion ("all" column) and the sum of the "Orthodox", "Catholic", "Protestant" and "other Christian" columns is made up of persons who declared themselves only Christians when asked about their religion.
Population by mother tongue, according to the 2002 and 2011 censuses.
| 2002 in total
| percent
| 2011 in total
| percent |
| REPUBLIC OF SERBIA
| 7 498 001
| 100
| 7 186 862
| 100 |
| Serbian
| 6 620 699
| 88,30
| 6 330 919
| 88,09 |
| Albanian
| 63 835
| 0,85
| 10 040
| 0,14 |
| Bosanski
| 134 749
| 1,80
| 138 871
| 1,93 |
| Bulgarian
| 16 459
| 0,22
| 13 337
| 0,19 |
| Bunjevacki
|
|
| 6 835
| 0,10 |
| Vlach
| 54 818
| 0,73
| 43 095
| 0,60 |
| Hungarian
| 286 508
| 3,82
| 243 146
| 3,38 |
| Macedonian
| 14 355
| 0,19
| 12 706
| 0,18 |
| German
| 2 279
| 0,03
| 2 190
| 0,03 |
| Roma
| 82 242
| 1,10
| 100 668
| 1,40 |
| Romanian
| 34 515
| 0,46
| 29 075
| 0,40 |
| Russian
| 2 199
| 0,03
| 3 179
| 0,04 |
| Ruthenian
| 13 458
| 0,18
| 11 340
| 0,16 |
| Slovak
| 57 498
| 0,77
| 49 796
| 0,69 |
| Slovenian
| 3 024
| 0,04
| 2 269
| 0,03 |
| Hrvatski
| 27 588
| 0,37
| 19 223
| 0,27 |
| Montenegrin
|
|
| 2 519
| 0,04 |
| Other languages
| 83 775
| 1,12
| 39 463
| 0,55 |
| They did not declare and unknown
| 63 877
| 0,85
| 128 191
| 1,78 |
National affiliation
The book also contains data for 21 ethnic communities, whose number in the territory of the Republic of Serbia exceeds two thousand members. In addition to data on the total number, data by age, average age and gender of members of ethnic communities are also given. Data by age are presented according to large age groups, namely: under 15, 15–29, 30–49, 50–64, 65–84, 85 and older.
According to the latest census in Serbia (without Kosovo and Metohija), a total of 7,2 million inhabitants were registered, and compared to the previous census (2002), the number of inhabitants decreased by 311,1 thousand due to negative natural growth, emigration, as well as incomplete coverage of the population, i.e. boycott of the Albanian national minority in three municipalities in the south of Serbia.
Serbs as the majority people number 6,0 million (83,3 percent), followed by Hungarians (253,9 thousand or 3,5 percent), Roma (147,6 thousand or 2,1 percent) and Bosniaks (145,3 thousand or 2,0 percent), while other nationalities participate with less than 1 percent, such as Croats (57,9 thousand or 0,8 percent), Slovaks (52,8 thousand or 0,7 percent), Montenegrins (38,5 thousand or 0,5 percent), Vlachs (35,3 thousand or 0,5 percent) and others. Ethnic communities with less than two thousand members (Egyptians, Ashkalis, Czechs, Jews, etc.) of which there are a total of 17 thousand (6 percent) are classified as "other nationalities".
The number of persons who used their right guaranteed by the Constitution and did not want to declare themselves national is 160,3 thousand (2,2 percent), and 30,7 thousand or 0,4 percent declared themselves in terms of regional affiliation (for example, from Vojvodina, Šumadinac, Valjevac, Beogradanin and similar)
In the last inter-census period (2002-2011), there was an absolute decrease in the number of members of the majority nationality (from 6,2 to 6,0 million, or by 3,6 percent) due to negative natural growth, which is a consequence of higher mortality than birth rates due to the old age structure (the average age of Serbs is 42,6 years), while the increase in their share (from 82,9 percent to 83,3 percent) is a consequence of the lower rate of growth among other nationalities.
In the past period, for almost all nationalities, there have been unfavorable trends in the decline of their number and share in the total population of Serbia, with the exception of Roma, Bosniaks, Muslims and some numerically smaller ethnic groups (Gorans, Germans, Russians...) which have recorded an increase.
Roma had an increase of over one third (growth index 136,4) thanks to high birth rates and low mortality rates due to the young age structure (average age is 28,3 years), constant changes of ethnic affiliation when declaring, mimicry reactions of Roma due to often present discrimination against them.
Bosniaks had an increase in numbers (from 136,1 thousand to 145,3 thousand or from 1,8 percent to 2,0 percent), which is the result of low mortality because they are a young population (average age is 33,5 years) and relatively high rates birth rate. In the past period, the demographic dynamics and stability of ethnic identification was similar for Muslims, so they recorded an absolute increase of 2,8 thousand (from 19,5 thousand to 22,3 thousand), while the share remained almost unchanged (0,3 percent ).
Yugoslavs recorded the biggest decrease. Their number decreased by more than three times (from 80,7 thousand to 23,3 thousand or from 1,1 percent to 0,3 percent), and in the previous inter-census period they had a large decrease (by as much as 70 percent).
After the Yugoslavs, Montenegrins experienced the largest decrease in numbers, primarily due to a change in ethnicity, so their number and share almost halved (from 69,0 thousand to 38,5 thousand or from 0,9 percent to 0,5 percent, growth index only 55,8 ).
In the period 2002-2011, the number of Croats decreased by 18 percent due to negative growth, an intensive process of demographic aging (average age is 51 years), as well as a negative migration balance, so their number and share decreased (from 70,6 thousand to 57,9 thousand, i.e. from 0,9 percent to 0,8 percent).
The population dynamics of Slovaks is stable with a slight downward trend (from 59,0 thousand to 52,8 thousand and the share from 0,8 percent to 0,7 percent) due to the advanced process of population aging (average age is 44,3 years) and negative natural growth, as the basic characteristics of demographic development.
Hungarians, numerically the largest national minority in Serbia, recorded an absolute decrease of 39 thousand or 4 percent (from 13,4 thousand to 293,3 thousand), as well as their share (from 253,9 percent to 3,9 percent). . The reasons are high mortality, low birth rate and consequently negative growth, as well as emigration and aging of the population (average age is 3,5).
The number of members of the Bulgarian national minority also continuously decreased in the previous period (from 20,5 thousand to 18,5 thousand, while the share remained unchanged), which can be explained by negative growth, intensive aging (the average age is even over 50 years old). , by declining birth rates, ethnic mimicry (more often declaring themselves as Yugoslavs), mixed marriages and migrations.
The Vlachs recorded undoubtedly the biggest changes in the population movement. In contrast to the previous inter-census period (1991-2002), when thanks to a change in national affiliation, i.e. declaring their ethnicity, they recorded an increase of almost three times (from 15 thousand to even 40 thousand), in the following period (2002-2011) on their demographic dynamics, the national declaration had less importance, and unfavorable trends in the natural movement of the population were decisive. High rates of negative growth due to the intensive process of demographic aging (the Vlachs are among the oldest populations in Serbia with an average age of over 50 years) is a key factor in the decline in their number (from 40,1 thousand to 35,3 thousand) and share (from 0,53 percent to 0,49 percent).[6]
There is a significant increase in the number of nationally undeclared persons (by as many as 53 thousand), as well as those who declared themselves in terms of regional affiliation (by 19,3 thousand), which is an indicator of current conditions in the country and citizens' attitudes towards national identification.
As Nada Raduški (Center for Demographic Research of the Institute of Social Sciences) concludes in the article Ethnic processes and national minorities in Serbia according to the 2011 census
, (NSPM December 8, 2013) in general, it can be said that the changes in the ethnic composition of the population of Serbia were less pronounced than in the previous inter-census period. The number of inhabitants decreased due to long-term negative tendencies in the natural renewal of the population, intensified emigration flows, while the trend of ethnic homogenization continued, although at a much lower intensity than in the period 1991-2002, when it was caused by huge, forced (refugee) and voluntary migrations of the population.
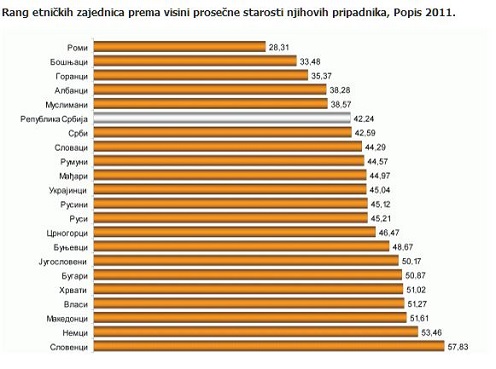
Ranking of ethnic communities according to the average age of their members, Census 2011.
The majority of members of ethnic communities have an average age above 42,2 years, which is the average for the Republic of Serbia. Serbs have almost the same average age (42,6), while the average age of members of seven ethnic communities is over 50 (Slovenes, Germans, Macedonians, Vlachs, Croats, Bulgarians and Yugoslavs).
Only five ethnic communities have an average age below the national average, namely: Muslims (38,6), Albanians (38,3), Gorani (35,4), Bosniaks (33,5) and Roma, who are the only ones with an average age below 30 years (28,3).
Source:
Religion, mother tongue and nationality Census of population, households and dwellings in 2011 in the Republic of Serbia
Book 4, RZS